The U.S. Beverage Industry
As the United States recovered from economic challenges, beverage market growth revived, but slow growth and mixed results characterized the marketplace. That seems to be changing: while only half of the 12 most significant categories grew in volume in 2012, eight did in 2014 and nine did in 2015.
Facts About the U.S. Beverage Industry
How big is the beverage market in the U.S.?
Total U.S. liquid consumption increased by 0.8% in 2015, reaching 61.7 billion gallons. That covers all beverages, including tap water.
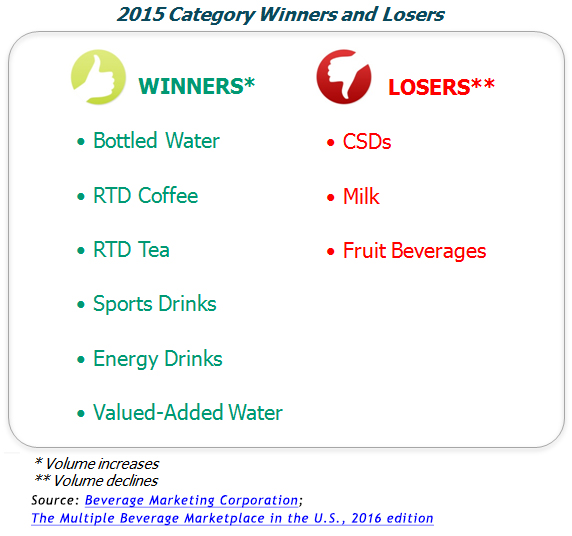
Which beverage categories grew in 2015?
The contingent of declining categories in 2015 again included the biggest one by volume. CSDs extended a long-running losing streak. Beer, which had stagnated the year before, grew in 2015. Milk, which slipped from fourth to fifth place, continued to decline in 2015. Fruit beverages also continued to fall.

Share this image on your website:
<img src="http://www.beveragemarketing.com/shop/images/resources/beverage-industry.jpg" alt="The U.S. Beverage Industry" <br />Source: <a href="http://www.beveragemarketing.com/shop/U.S.-Beverage-Industry.aspx">The U.S. Beverage Industry</a>
U.S. Beverage Industry Analysis
While volume growth shows mixed results, beverage marketers' and suppliers' revenues provide another perspective on the industry, and from this angle, performances looked somewhat stronger: 11 of the 12 categories, including two that decreased in volume, registered growth in wholesale dollars in 2015 according to Beverage Marketing Corporation's market report entitled The Multiple Beverage Marketplace in the U.S.
U.S. Multiple Beverage Market
Non-alcohol and Alcohol Beverages
Volume and Wholesale Dollars and Change
2014 - 2015 |
|
|
| |
2014 |
2015 |
% Change 2014/15 |
| Millions of Gallons |
61,220.6 |
61,712.4 |
0.8% |
| Millions of Dollars |
$229,304.9 |
$234,326.7 |
2.2% |
| |
| Source: The Multiple Beverage Marketplace in the U.S. published by Beverage Marketing Corporation; Distilled Spirits Council of the United States; Florida Department of Citrus; International Dairy Foods Association; U.S. Tea Association |
Adding a comparison of retail sales into the mix adds a third level of perspective. Total U.S. beverage market retail sales grew at a slightly faster rate than wholesale dollars sales in 2015 – and all but one beverage category (milk) contributed to the upward movement. Examination of all aspects of category and cross-category comparison yields additional insights. For example, CSDs, which have lost volume, gained in both wholesale dollars and retail dollars in 2015. That said, in terms of retail dollars, the category lost market share points from 2010 to 2015, while third-place distilled spirits augmented their share. Meanwhile, fruit beverages, which declined from both a volume and wholesale dollar perspective, posted retail dollar growth in 2015. For more information on a broad range of beverage categories including statistics, analysis and forecasts, see The Multiple Beverage Marketplace in the U.S., published by Beverage Marketing Corporation.